|
toddclements.com |
Image Data Acquisition ProgramImage was written in Visual C++ (6.0) using MFC. Here are some screenshots from the Image data acquisition program:
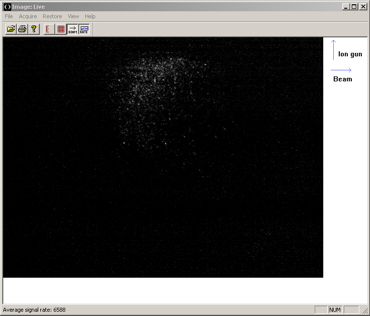
The image window shows the current image. In this case, live acquisition is chosen, and the user can choose the number of images to average for each display. The direction of the ion beam and neutral beam is clearly shown. The toolbar shows icons for the axes that can be overlain on the image for approximate measuring purposes.
The timing of the firing of the pulsed valve can be controlled through this window. The sliders work just as expected. Currently the nozzle is under computer control, which is why the value of the timing is outside the valid range of the slider.
The average signal rate is recorded over time to look at effects of changing timing, or other conditions of the experiment. The line in blue is an average of the data in black. The chart was made with my plotting library, CPlot.
This dialog allows the user to set up a series of experiments where the timing will be varied across a range, and the average signal recorded. Theoreticaly, if the beams are on-axis and you pass through the correct timing, the average signal should increase at that timing. Notice the large lettering so that the average signal rate can be read from far away while changing experimental parameters. |
||||


